Nominal GDP and real GDP per head from eh.net/hmit/gdp/ | Federal receipts from page 22 of | ||||||||||||
http://www.whitehouse.gov/omb/budget/fy2005/pdf/hist.pdf | |||||||||||||
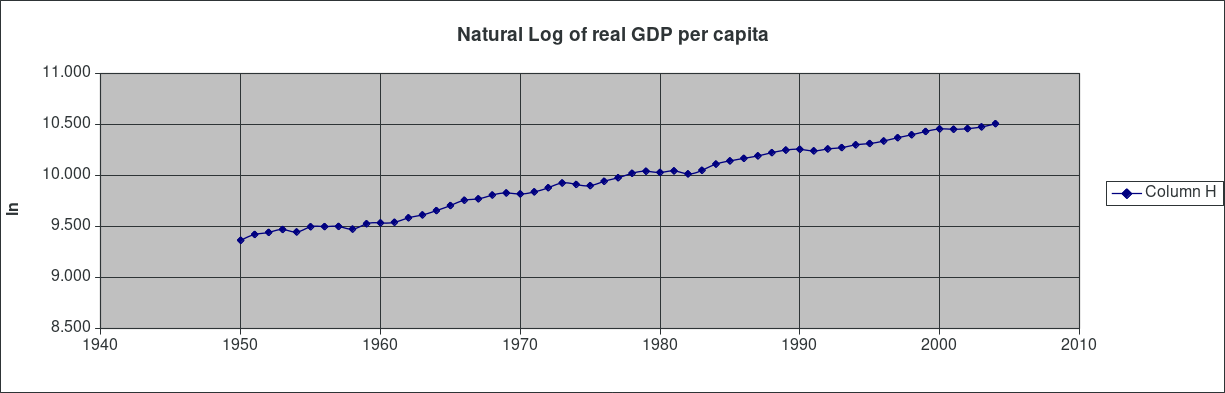
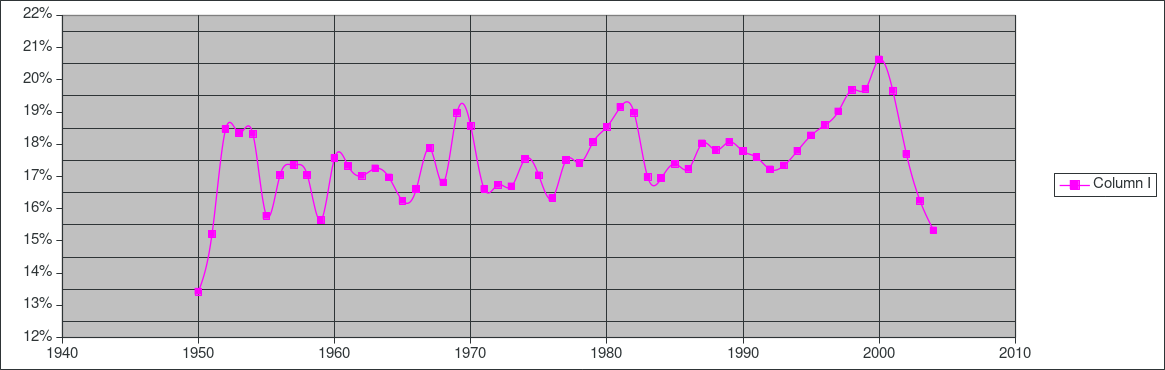
Year | nominal GDP millions | Receipts millions | Ratio of Receipts to GDP | Real GDP per head in year 2000 dollars | Year | ln real GDP per head | Receipts to GDP | growth on past year | Average growth in high tax years | Average growth in low tax years | |||
1950 | 293800 | 39443 | 0.1343 | 11672 | 1950 | 9.365 | 13.4251% | ||||||
1951 | 339300 | 51616 | 0.1521 | 12365 | 1951 | 9.423 | 15.2125% | 5.768% | 1.08% | 2.43% | |||
1952 | 358300 | 66167 | 0.1847 | 12620 | 1952 | 9.443 | 18.4669% | 2.041% | Defining high tax years as federal receipts more than 18.1% of GDP | ||||
1953 | 379400 | 69608 | 0.1835 | 12982 | 1953 | 9.471 | 18.3469% | 2.828% | for reasons that should be apparent by looking at the graph | ||||
1954 | 380400 | 69701 | 0.1832 | 12669 | 1954 | 9.447 | 18.3231% | -2.441% | |||||
1955 | 414800 | 65451 | 0.1578 | 13336 | 1955 | 9.498 | 15.7789% | 5.131% | |||||
1956 | 437500 | 74587 | 0.1705 | 13356 | 1956 | 9.500 | 17.0485% | 0.150% | |||||
1957 | 461100 | 79990 | 0.1735 | 13380 | 1957 | 9.502 | 17.3476% | 0.180% | |||||
1958 | 467200 | 79636 | 0.1705 | 13033 | 1958 | 9.475 | 17.0454% | -2.628% | |||||
1959 | 506600 | 79249 | 0.1564 | 13728 | 1959 | 9.527 | 15.6433% | 5.195% | |||||
1960 | 526400 | 92492 | 0.1757 | 13847 | 1960 | 9.536 | 17.5707% | 0.863% | |||||
1961 | 544700 | 94388 | 0.1733 | 13936 | 1961 | 9.542 | 17.3284% | 0.641% | |||||
1962 | 585600 | 99676 | 0.1702 | 14556 | 1962 | 9.586 | 17.0212% | 4.353% | |||||
1963 | 617700 | 106560 | 0.1725 | 14976 | 1963 | 9.614 | 17.2511% | 2.845% | |||||
1964 | 663600 | 112613 | 0.1697 | 15627 | 1964 | 9.657 | 16.9700% | 4.255% | |||||
1965 | 719100 | 116817 | 0.1624 | 16423 | 1965 | 9.706 | 16.2449% | 4.968% | |||||
1966 | 787800 | 130835 | 0.1661 | 17293 | 1966 | 9.758 | 16.6076% | 5.162% | |||||
1967 | 832600.0 | 148822 | 0.1787 | 17536 | 1967 | 9.772 | 17.8744% | 1.395% | |||||
1968 | 910000.0 | 152973 | 0.1681 | 18199 | 1968 | 9.809 | 16.8102% | 3.711% | |||||
1969 | 984600.0 | 186882 | 0.1898 | 18578 | 1969 | 9.830 | 18.9805% | 2.061% | |||||
1970 | 1038500.0 | 192807 | 0.1857 | 18395 | 1970 | 9.820 | 18.5659% | -0.990% | |||||
1971 | 1127100.0 | 187139 | 0.1660 | 18774 | 1971 | 9.840 | 16.6036% | 2.039% | |||||
1972 | 1238300.0 | 207309 | 0.1674 | 19557 | 1972 | 9.881 | 16.7414% | 4.086% | |||||
1973 | 1382700.0 | 230799 | 0.1669 | 20488 | 1973 | 9.928 | 16.6919% | 4.651% | |||||
1974 | 1500000.0 | 263224 | 0.1755 | 20199 | 1974 | 9.913 | 17.5483% | -1.421% | |||||
1975 | 1638300.0 | 279090 | 0.1704 | 19962 | 1975 | 9.902 | 17.0353% | -1.180% | |||||
1976 | 1825300.0 | 298060 | 0.1633 | 20826 | 1976 | 9.944 | 16.3294% | 4.237% | |||||
1977 | 2030900.0 | 355559 | 0.1751 | 21570 | 1977 | 9.979 | 17.5075% | 3.510% | |||||
1978 | 2294700.0 | 399561 | 0.1741 | 22531 | 1978 | 10.023 | 17.4123% | 4.359% | |||||
1979 | 2563300.0 | 463302 | 0.1807 | 22987 | 1979 | 10.043 | 18.0744% | 2.004% | |||||
1980 | 2789500.0 | 517112 | 0.1854 | 22716 | 1980 | 10.031 | 18.5378% | -1.186% | |||||
1981 | 3128400.0 | 599272 | 0.1916 | 23061 | 1981 | 10.046 | 19.1559% | 1.507% | |||||
1982 | 3255000.0 | 617766 | 0.1898 | 22400 | 1982 | 10.017 | 18.9790% | -2.908% | |||||
1983 | 3536700.0 | 600562 | 0.1698 | 23199 | 1983 | 10.052 | 16.9809% | 3.505% | |||||
1984 | 3933200.0 | 666486 | 0.1695 | 24652 | 1984 | 10.113 | 16.9451% | 6.075% | |||||
1985 | 4220300.0 | 734088 | 0.1739 | 25444 | 1985 | 10.144 | 17.3942% | 3.162% | |||||
1986 | 4462800.0 | 769215 | 0.1724 | 26084 | 1986 | 10.169 | 17.2362% | 2.484% | |||||
1987 | 4739500.0 | 854353 | 0.1803 | 26725 | 1987 | 10.193 | 18.0262% | 2.428% | |||||
1988 | 5103800.0 | 909303 | 0.1782 | 27578 | 1988 | 10.225 | 17.8162% | 3.142% | |||||
1989 | 5484400.0 | 991190 | 0.1807 | 28285 | 1989 | 10.250 | 18.0729% | 2.531% | |||||
1990 | 5803100.0 | 1031969 | 0.1778 | 28493 | 1990 | 10.257 | 17.7831% | 0.733% | |||||
1991 | 5995900.0 | 1055041 | 0.1760 | 28067 | 1991 | 10.242 | 17.5960% | -1.506% | |||||
1992 | 6337700.0 | 1091279 | 0.1722 | 28601 | 1992 | 10.261 | 17.2188% | 1.885% | |||||
1993 | 6657400.0 | 1154401 | 0.1734 | 28981 | 1993 | 10.274 | 17.3401% | 1.320% | |||||
1994 | 7072200.0 | 1258627 | 0.1780 | 29779 | 1994 | 10.302 | 17.7968% | 2.716% | |||||
1995 | 7397700.0 | 1351830 | 0.1827 | 30163 | 1995 | 10.314 | 18.2737% | 1.281% | |||||
1996 | 7816900.0 | 1453062 | 0.1859 | 30917 | 1996 | 10.339 | 18.5887% | 2.469% | |||||
1997 | 8304300.0 | 1579292 | 0.1902 | 31922 | 1997 | 10.371 | 19.0178% | 3.199% | |||||
1998 | 8747000.0 | 1721798 | 0.1968 | 32868 | 1998 | 10.400 | 19.6844% | 2.920% | |||||
1999 | 9268400.0 | 1827454 | 0.1972 | 33939 | 1999 | 10.432 | 19.7170% | 3.207% | |||||
2000 | 9817000.0 | 2025218 | 0.2063 | 34788 | 2000 | 10.457 | 20.6297% | 2.471% | |||||
2001 | 10128000.0 | 1991194 | 0.1966 | 34692 | 2001 | 10.454 | 19.6603% | -0.276% | |||||
2002 | 10469600.0 | 1853173 | 0.1770 | 34899 | 2002 | 10.460 | 17.7005% | 0.595% | |||||
2003 | 10971200.0 | 1782342 | 0.1625 | 35492 | 2003 | 10.477 | 16.2456% | 1.685% | |||||
2004 | 11734300.0 | 1798093 | 0.1532 | 36627 | 2004 | 10.509 | 15.3234% | 3.148% | |||||
2005 | 2036273 | 2005 | |||||||||||